WXMPLOT: plotting widgets for Python
wxmplot provides high-level, interactive plotting of scientific data for Python, combining wxPython and matplotlib.
matplotlib provides excellent general-purpose plotting functionality. While it supports many backends, it does not have tight integration with any particular GUI toolkit. And while the matplotlib.pyplot module provides easy-to-use, high-level functions for plotting and displaying data, it has minimal interactivity and ability to customize plots after they are mde.
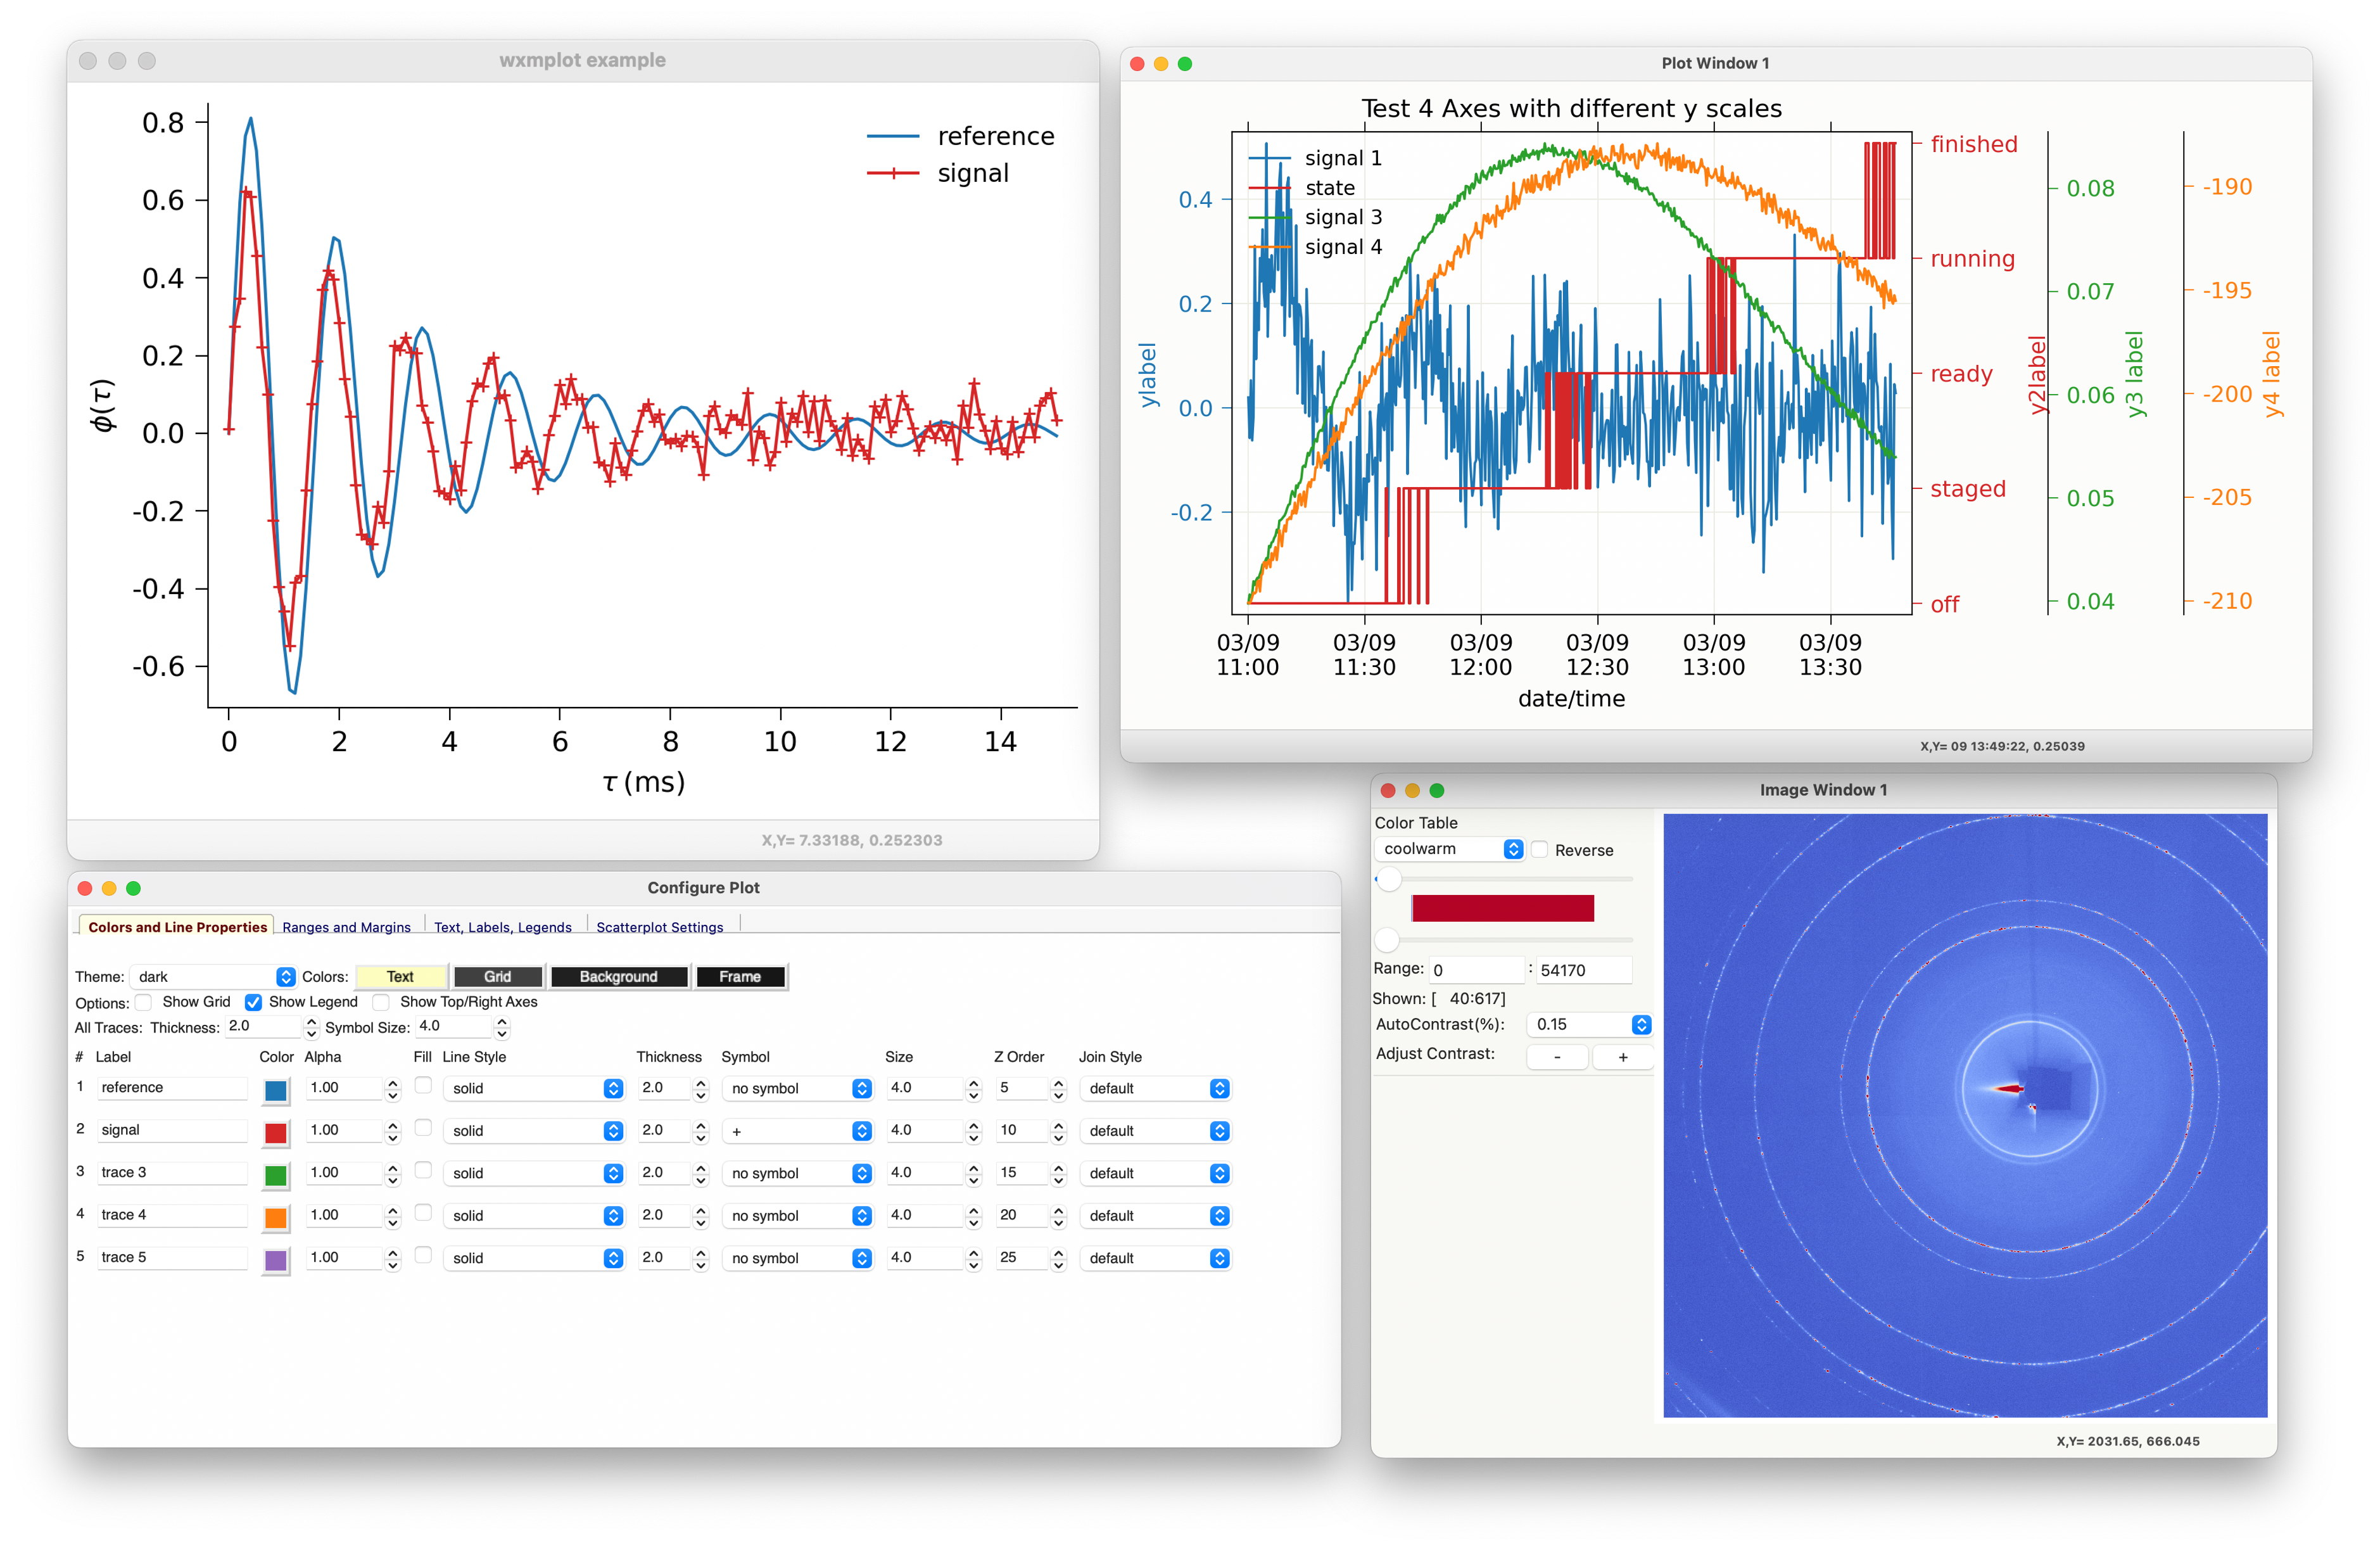
wxmplot combines matplotlib and wxPython to provide graphical elements (wxPython widgets) and user-friendly, interactive functions for basic line plots, image display, and some custom plots such as histograms and scatter plots. The displays made with wxmplot give end-users interactive displays of their data that allow zooming and un-zooming, reporting mouse positions, rotating images, and changing color themes. The displays are highly configurable, helping the user to change many aspects of the plot such as colors, line types, labels, marker type, color tables, smoothing. While wxmplot does not expose all of matplotlib’s capabilities, it handles many of the most common plotting and image display needs for scientific data, and makes these highly interactive. It also permits access and to the underlying matplotlib API for those that need it.
The functions in wxmplot.interactive are particularly easy to
use, and enable script writers to make XY line plots and image
displays from their data, and to interact with and configure these
displays as part of exploratory data analysis. Programmers can use
the wxmplot widgets to include these high quality graphical displays
of data in their wxPython applications to enable users to explore
their data.
- Downloading and Installation
- wxmplot Overview
- Interactive wxmplot displays
PlotPanel: A wx.Panel for Basic Line PlotsImagePanel: A wx.Panel for Image Display- wxmplot Examples
- Dynamic examples not shown here
- Scatterplot Example
- Plotting with errorbars
- Plotting data from a datafile
- Plotting data with discrete values
- Using Left and Right Axes
- Using 3 and 4 Y Axes
- Plotting with alpha-fill to show area under a curve
- Plotting with alpha-fill to show uncertainty
- Using set_data_generator for user-controlled, dynamic plotting
- Displaying and image of a TIFF file
- 3-Color Image
- Speciality wxmplot displays
- Comparisons of wxmplot with other Python Plotting tools